Pistil’s Phish Picks, Week 2

7-25-98 Piper – This one isn’t about the jam…it’s about the amazing, nearly 4 minute intro.  The song builds ever so gently before finally reaching it’s stride nearly 3 minutes in!  I love this chord progression, so extending the intro is something that is right up my alley.  It’s an energetic version that features absolutely nothing in the way of Trey soloing (compared to the screaming solos he started incorporating in ’99 and ’00).

5-19-94 Stash – This was one intense and brilliant version that features a loopy/swriling piece that -almost- goes into a major-key jam before Trey just rips up the finish.

12-31-99 Rock and Roll – This was the moment when this set went from a Phish concert, to something else entirely.  Watch for the “Father Time” cowbell jam starting around 12:10.  After that segment concludes you should hide the children because they aren’t of age to withstand the music that will eminate from the listening device of your choice.

6-24-97 Wolfman’s Brother – The best version that no one has heard.  One could argue that this was the most inventive song in the Phish catalog, c. Summer 1997 (though Gumbo, 2001, Bathtub Gin and Ghost could all have a say in the argument).  This one will open your ears up.  Europe did great things for Phish..and vice versa.

7-7-99 What’s the Use? – I was there for this version, so it holds a special place in my heart.  Don’t be shy in turning this up loud as there is quite a lot going on sonically.  These early renditions of WtU? are my favorites.

11-19-96 Bathtub Gin->Vibration of Life – This comes straight out of my favorite set from 1996.  This Gin is an interesting example of the state of flux that Phish found themselves that fall.  It melds the spacy rhythmic jams from 1995 (often with Trey on drum kit), the angrier, seemingly frustration-rich jams from Fall 1996 with an infusion of funkiness vis-a-vis the Remain in Light cover .  This is another oft overlooked gem…hell, I’ll go as far as saying that it’s every bit as good as the much more lauded version played on 11-7-96.

10-6-95 Slave to the Traffic Light – Sublime and tranquil version with Trey playing these gorgeous arpeggios throughout a significant portion of the jam.  When this song is played well, it’s among the most beautiful in the entire Phish catalog…I think this version gets there.

10-6-95 Slave to the Traffic Light – Sublime and tranquil version

with Trey playing these gorgeous arpeggios throughout a significant

portion of the jam.  When this song is played well, it’s among the

most beautiful in the entire Phish catalog…I think this version

gets there.
Pistil’s Phish Picks, Week 1

Here is a new installment where I give readers a chance to sample some miscellaneous favorites from my Phish collection.  Hopefully I’ll have the motivation to keep this up, but who the hell knows?  In order to keep an element of mystery regarding my selections, you’ll have to click “play” in order to hear what I have chosen.  Enjoy.

Rejected

SPY

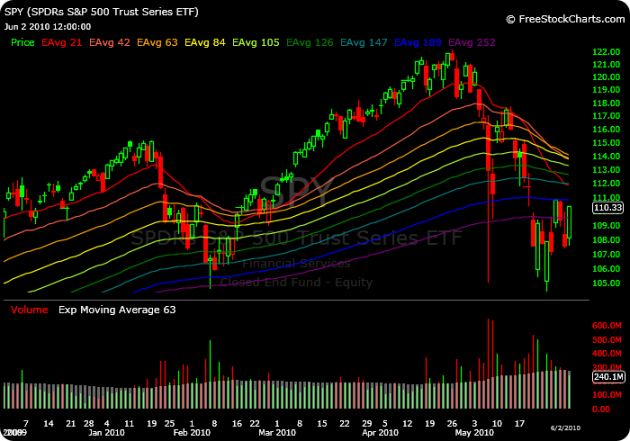
After nearly a 1% gap at the open, SPY came back to Earth late in the day and ended up closing in the red below the 1 month (21) EMA.  Even with a head start, bulls failed to overcome this repeated region of resistance for the third time in this correction.  In addition, prices were also thwarted right around 111, much like they were on 5/27, 5/28 and 6/3.  Clearly a range is being hammered out between 105 and 111…and it’s eventually going to break.  I suppose a silver lining was that prices were able to make it back to 111 instead of stalling and making a lower correction high.  With that news, even if prices are to decline again, by the time we get to 105, chances are the market will be oversold and bears will have great difficulty pushing prices much lower.

Even though I went “short” the market today via SDS and VXX, I’m not completely convinced that this market is going to reverse.  As I hypothesized last week, I was preparing for a feeble attempt at price moving above the 21 EMA and eventually falling below the average on weak volume.  That scenario played out this afternoon, so I decided to put my money where my mouth is.  Additionally, the setups I saw for both trades looked good, thus strengthening my conviction.  Nevertheless, I will be keeping those positions on a very short leash.  If there is any evidence of momentum pushing prices above the 111 region on SPY, I will not hesitate to liquidate them.

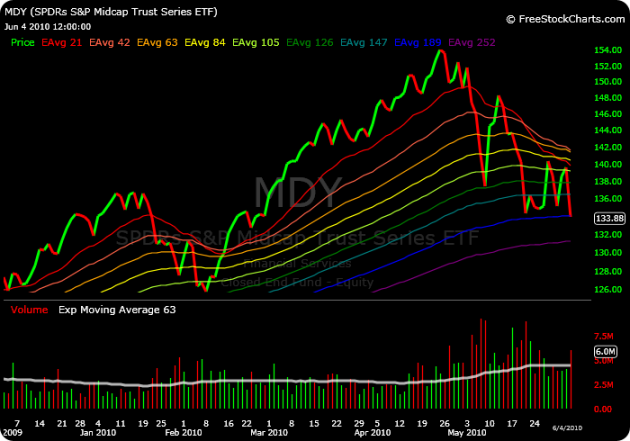
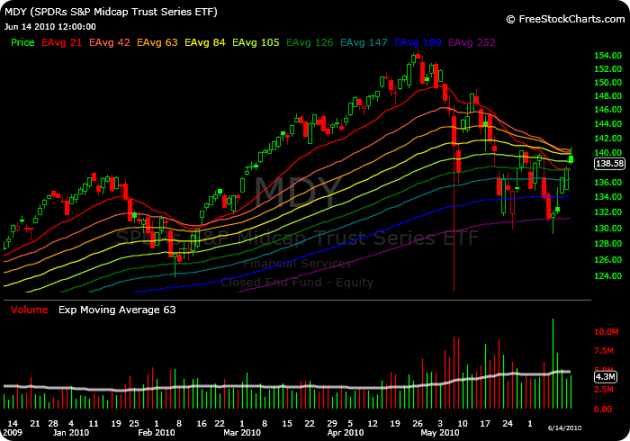
In other news, both mid-caps and emerging markets were able to close above their 1 month EMA’s…all is not lost.  Right now, MDY and EEM are the strongest of the ETF’s I’m following.  If my short scenario does not work out, I may look to start building a position in either one of those two.

MDY

EEM

I feel good about my risk/reward on both trades (SDS and VXX), so it’s nice to actually have some active capital back in the market after being in cash for a bit.

Interesting Development

UPDATE: long SDS @ 33.71 and VXX @ 27.90

Several inverse ETF’s and VXX have shown up on my swing trade screen today.  Based on this fact and the underwhelming volume of the markets, I’m going to go long the following:

SDS

VXX

I have gone long VXX twice with great success since the correction has begun, buying the dip each time.  This will be my first foray into an inverse ETF since February…my track record downright sucks with these things.  Let it be stated that my rationale for purchasing them in the past was purely speculative and just trying to catch a top.  This setup is much more appealing from a number of perspectives (risk/reward at the top of that list).  I’ll update this post with my entry prices in a bit.

Take a Step Back

I often fail to utilize the benefits of viewing charts on multiple time-frames.  Sure, I glace at intraday charts from time to time to see when volume came into or out of a market, but I don’t usually venture farther out than the daily.  Over the years of reading blogs, I have noticed that I am not alone as I have observed very few others incorporating longer time frame charts into their analysis.  Maybe this has to do with the preponderance of short-term, high-speed trading that many people choose to partake in.  In this case, sure, I understand that a weekly chart isn’t going to provide a great deal of insight regarding positions that you plan on liquidating in a matter of hours, if not minutes.  Maybe weekly charts are viewed as antiquated and not really very useful in gauging near term market sentiment.  Regardless, I do feel that they (weekly charts) can provide an interesting and balanced perspective to the relative chaos that can clutter a daily (or shorter-term) chart.

In light of the recent correction,  I have been increasingly interested in the developments on the weekly charts of the ETF’s I follow.  As I have mentioned many times in the past, the daily charts are in need of repair, and only time can alleviate their level of distress.  Below is a 1 year window of the SPY weekly chart.

SPY Weekly (1 year)

If this were a daily chart, I would consider this an orderly pullback and actually a decent buying opportunity.  There are two weeks of heavy selling, but that has diminished as the market has tried to find a bottom and there was decent accumulation 2 of the last 3 weeks as well.  The moving averages are in what I would consider a very bullish pattern, with the 3, 6, 12 and 24 month averages stacked in chronological order.  I also find it interesting that the correction in January/February found it’s bottom right at the 2 year moving average…right about where the most recent bottom is as well.  After staring at this chart for a while, I was wondering if the recent 12 month crossover of the 24 month held any sort of long-term significance.  Here is a chart back to 2002:

SPY Weekly (8ish years)

Since 2003, the 12 month moving average has crossed above the 24 month moving average exactly twice…once in January 2004 and again in late April 2010.  Here we find ourselves at a point where just about everyone thinks the market is bound to move lower.  Based on the current state of affairs in the national and global economy, I’m certainly not one to disagree with that assertion.  However, after looking at this chart, I’m can’t help but think that we could be looking at a decent long-term buying opportunity.  Also, the contrarian in me says that when everyone starts turning (nearly) exclusively into bulls or bears, the best bet is to do the opposite.

SPY Daily

Even with this information, I’m still not confident enough to start allocating money to the long side.  As I have said a number of times, from a daily perspective I need to first see a higher correction high.  That downward sloping trendline looks very bearish, and until buyers can break through, I won’t change my stance.   Prices have been consistently rejected from the 1 month EMA throughout this correction.  Much like the aforementioned trendline, this is proving to be a significant level of resistance.  Nevertheless, the weekly charts present a evidence that this might just be nothing more than an early bull market correction in addition to a potentially strong buying opportunity.

Market Emergence

Eating crow is my favorite pastime…so…to everyone whom I badgered yesterday for purchasing stock on 6/9, congratulations on your copious profits from today’s advance.  I admit, while things looked grim after yesterdays reversal, I didn’t have a strong feeling about the market continuing to decline.

SPY

Today’s advance was encouraging for several reasons.  At no point did buyers relinquish control of the affairs.  In the SPY, prices reversed only to the point where the market opened (and that was a pretty significant, nearly 2 point gap) and volume came in above average.  Even with yesterday’s intraday reversal, I have to say that I’m encouraged with the action since testing the lows earlier this week.

Allow me to temper that optimism with the fact that SPY still hasn’t reached it’s 1 month (21) EMA yet.  This area has proven to be the upper bound of any rally attempt since early May…and that is a decidedly bearish scenario.  Right now the average stands less than a point above today’s close, so tomorrow could be a most interesting day.  Additionally, I’m still wary of the intraday volatility in this market.  When was the last time the market failed to move at least 1% within the course of a single trading session?  I prefer to allocate capital to try and capture slow and steady gains.  You can make a lot of money in a short amount of time in this market…but you can lose it, and more, just as fast.  Therefore, I’d rather just sit back and wait.  I know, I know…very exciting.

EEM

In reference to the title of this post, lets take a peek at EEM.  Notice that emerging markets have pushed through and closed above the 1 month EMA.  This development is providing additional confidence that this rally might actually have some legs behind it.  If EEM can close above the high of 39.01 from 6/3, that will be a very good sign…finally something is making a higher high.  The US markets have been playing “follow the leader” with EEM since the 2008 bottom, so seeing relative strength here is encouraging.  I’d really prefer to see some greater volume accumulation in the coming days, especially if it manages to make a higher high.  We aren’t out of the woods yet, but at least there is -something- to be hopeful about.

This Just In

Chances are, you are probably not going to go long the market right at the bottom and make a killing on the way up.  Just look at today…things are humming along, for the most part everything is looking good.  Next thing you know, prices take a decidedly negative turn into the close. Those people out there who thought: “shit, this market is taking off, this could be the bottom, I can’t ‘afford’ to miss out on this” are now afforded the opportunity to log into their brokerage accounts and see their positions under water.  Then again, what the hell do I know?  You may get really lucky and this might actually be the bottom.

Like everyone else who tries their hand in the stock market, the goal is to make money.  From what I’ve seen, read and experienced, the people who make money over the long run aren’t the people who accurately call bottoms and tops…because that is purely a crap shoot.  Yes, you may get lucky once, twice, hell maybe even three times…but eventually it will probably catch up with you.  I thought I was smart enough to call the top throughout 2009, and ended up losing money on EVERY SINGLE ONE of those trades.  So, in order to preserve capital, I learned how to eliminate those stupid trades from my repertoire.  Sure, I still get the feeling like “I’m missing this rally, what if this is the bottom, should I get in?”…but my discipline is far more honed than it used to me.  I can’t afford to be wrong and get hammered with 2% daily losses anymore.  Currently, a number of events would have to unfold for me to consider moving the bulk of my money to the long side…and right now, that is a LONG way away from happening (no pun intended).

SPY

So, it looked like we were on our way back to try and meet up with the 1 month (21) EMA, then prices stall around 108 and they plummet nearly 2 points into the close.  Again, these huge price swings scare the hell out me…unless you have a strategy that is based solely on profiting from crazy volatility, I think a much a more rewarding strategy is to sit back on your cash and just observe.  I sincerely hope the bulls can muster more of a rally than today’s pathetic attempt, else it’s only a matter of “when” not “if” the support south of 105 is taken out.  Granted volume came in lower than yesterday, but it was low all morning and eventually gained momentum once the market started to drop…not a good sign.  The endless days of green candles from Feb-April seem like a distant memory, don’t they?  I do seem to gain a sadistic sense of enjoyment watching this volatile market…which probably stems from my unwillingness to get financially involved with such matters.  These next few days could prove to be very interesting indeed.

Strike 3?

Well, once again prices tested the 104-105 range today on the SPY for the third time since the start of May, and once again buyers dug in their heels and held the line.  How many times can this hold?  The market continues to bottom out right around this area, yet continues to make lower highs…therefore the coil continues to tighten.  Yet again support in this region came after an extended period of selling, thus leaving the market in an extreme “oversold” state.  What if prices advance to the descending 1 month (21) EMA (as they have on previous rallies from the 105 level) then begin to drop again?  Chances are the market won’t be oversold at that point, and there is a strong possibility that the levee could break.  I’m not big into making predictions, but right now, that is one hypothesis I am exploring…and I will be looking to short the market with a tight stop if we rally back to the 21 EMA.  While SPY, DIA and EEM all enjoyed over 1% gains today, the lack of conviction from both QQQQ and IWM is pretty glaring.  QQQQ and IWM have been the strongest of my ETF’s over the past few weeks (though IWM has taken a beating as of late), and watching them lag throughout the day tells me that this “rally” may not be all it’s cracked up to be.  Granted, both may take off tomorrow, but this lack of relative strength is something to watch.

SPY

On a positive note, SPY did advance over 1% today on above average volume.  Great, but taking a look back at the last rally from the 105 level shows almost 35 million more shares being traded (396 mil on 5/25), and we all know where that rally got us.  We are going to need to see greater accumulation in SPY and a high volume advance from QQQQ (specifically) if I am going to have any sort belief that the worst is over…making a higher high on the SPY wouldn’t hurt either.

EEM

One thing that I have touched on in the past is how emerging markets (EEM) are performing relative to the other ETF’s.  Several interesting observations come to mind looking at the chart.  The most recent leg down that led to new ‘correction’ lows in the US markets was not confirmed by EEM.  In fact, prices haven’t even come close to the lows put in on 5/25.  None of my other ETF’s can stake that claim, with only QQQQ maintaining a higher low (but not to the degree of EEM).  Also, it appears that distribution has started to wane a bit, with the emergence of several above average green volume bars (5/27, 6/2, 6/8).  Again, EEM started to drop and failed to make new highs in April, well before the US markets…could we possibly be seeing a similar phenomenon here at the bottom?  My previously stated hypothesis regarding SPY does significantly hinge on the behavior of EEM in relation to the US markets.  This never gets dull, does it?

ETF Update 06-04

Eschewing my lengthy nonsensical banter, with this post I’m going to post charts for the ETF’s that I’m following, in rank order.  Keep in mind that I use SHY as a proxy for cash, and that is where the vast majority of my money resides at the moment (along with a small VXX speculative position and a bit of cash).  Additionally, SHY is my top ranked ETF, but posting it’s chart would be pointless as I don’t perform any sort of analysis on it…I just move my money there when my screen tells me to do so.

QQQQ

MDY

IWC

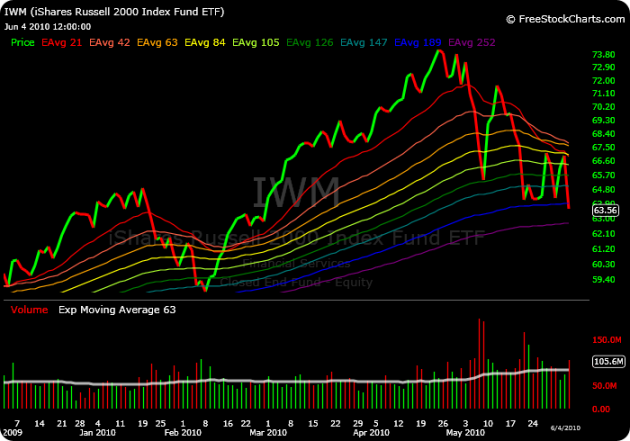
IWM

EEM

DIA

SPY

Thrill and Agony

This stock market reminds me of when Homer took Bart to the futures exchange and proclaimed “Whohoo, d’oh, whohoo, d’ooooh” after watching his contract make a ton of money then instantly lose a ton of money.  Just yesterday the sky was falling and I’m talking about SPY going sub 90, today it plows ahead for a 2.5% gain.  This market is crazy…I just can’t see how anyone could feel comfortable holding any sort of meaningful positions overnight in this kind of environment.  Hell, we could be down 3% or up 3% tomorrow.  I’m sure some people are nimble and smart enough to make money in this type of environment, but I’m sluggish and stupid when it comes to trading stocks.  I’d rather wait for the market to make up it’s mind then hitch my wagon to that train for the ride.  You could be feeling great one day and being called for a margin liquidation the next.  That’s not the formula I hope to employ in order to become a successful stock investor.

QQQQ

How about that…QQQQ closed right at Tuesday’s high.  This ETF is exhibiting the best behavior, relative to prior price action of the 7 that I’m watching, having closed above the gap on 5/21 and well into the candle from 5/20.  While the price is encouraging, I’m still concerned about the lack of volume for a day with such significant gains.  I thought this was of key importance after the advance last Thursday, so I’m not going to change my stance after volume really dried up today on what was a significant advance.  The 1 month EMA (21) is about to cross the 5 month EMA (105) to the downside…right up against where prices closed today.  Will this prove to be a level of resistance, or, if the price moves above this confluence, could this be a clue that things aren’t as bad as they seem?  Sure I’m waffling here, but I don’t have any clue as to what is going to happen, so I’m just pointing out things that I’m going to be watching out for.  As of today, other than SHY, QQQQ is the top ranked ETF I’m following.

SPY

Impressive price, lackluster volume and it’s still trading in that multiday range.  I can’t help but feel like this is the calm before the storm.  With as much volatility as we have seen since the beginning of May, prices are only going to keep fluctuating with daily 1+/- % moves in a 6 point range for so long before something has to give.  I’ve certainly been wrong many times in the past, but I still have yet to see any sort of meaningful rally by the bulls coming on significant volume.  Until that happens, I have to think that the break is eventually going to happen to the downside.  Hell, volume was well below average today…that’s no way to put some oomph behind a + 2.6% move.

Anyway, I’m going to continue to sit back and make fairly obvious observations, staying patient and waiting for the market to show it’s hand…because right now it’s doing one hell of a job bluffing.